


GKP daily 31/07/13
in ChartsView Blog:- Font size: Larger Smaller
- Hits: 5004
- 0 Comments
- Subscribe to this entry
- Bookmark

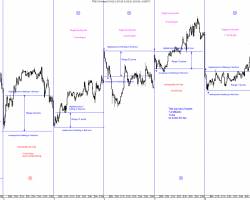
Here we have today's closing daily chart showing quite a few trendlines, supports and resistances.
The first thing to note is that it closed back inside the uptrend support from the 129.25p low so that support remains in tact for now at least.
I've also slightly re-drawn the downtrend resistance from the 260p high to take account of the recent 184.75p high though I still believe that a close above 180/2p (which we haven't yet had) is more important.
As can be seen, support was found today at the original breakout point of this move up which was 158p and the fact that price closed back inside the uptrend, having dropped a fair way out of it, it bullish IMHO.
Generally there seems to be two main ways of viewing the whole post-126p sequence: the camp that views at as a big bearish wedge which appeared to be the source of the resistance at 184.75p (the more horizontal bottom left to top right oblique line) and those, like me, who see it as an upward channel which is a separate move to the earlier rise (shown by the dotted line).
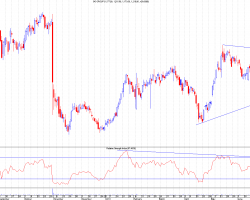
We can also see that the RSI uptrend from the 129p low remained firmly intact today and wasn't even properly tested. Usually I like to see the RSI break down first, before price; the other way round does often give false breakouts as I've mentioned on other threads before.
The exact nature of the wave count now is uncertain and I have 4 bullish options and the obvious bearish 3 wave wedge option to choose from. I'm going to need to look at them a bit closer, but for now I remain bullish due to the uptrend channel staying intact when there was a clear opportunity for the bears to keep it down. In addition, today's higher low (compared to the low at 151.25p) came with a lower low in RSI. This is known as a positive RSI divergence (or a momentum discrepancy reversal point) and these can be continuation patterns which also suggest the uptrend should continue.
The drama continues....
The first thing to note is that it closed back inside the uptrend support from the 129.25p low so that support remains in tact for now at least.
I've also slightly re-drawn the downtrend resistance from the 260p high to take account of the recent 184.75p high though I still believe that a close above 180/2p (which we haven't yet had) is more important.
As can be seen, support was found today at the original breakout point of this move up which was 158p and the fact that price closed back inside the uptrend, having dropped a fair way out of it, it bullish IMHO.
Generally there seems to be two main ways of viewing the whole post-126p sequence: the camp that views at as a big bearish wedge which appeared to be the source of the resistance at 184.75p (the more horizontal bottom left to top right oblique line) and those, like me, who see it as an upward channel which is a separate move to the earlier rise (shown by the dotted line).
We can also see that the RSI uptrend from the 129p low remained firmly intact today and wasn't even properly tested. Usually I like to see the RSI break down first, before price; the other way round does often give false breakouts as I've mentioned on other threads before.
The exact nature of the wave count now is uncertain and I have 4 bullish options and the obvious bearish 3 wave wedge option to choose from. I'm going to need to look at them a bit closer, but for now I remain bullish due to the uptrend channel staying intact when there was a clear opportunity for the bears to keep it down. In addition, today's higher low (compared to the low at 151.25p) came with a lower low in RSI. This is known as a positive RSI divergence (or a momentum discrepancy reversal point) and these can be continuation patterns which also suggest the uptrend should continue.
The drama continues....
Trackback URL for this blog entry.